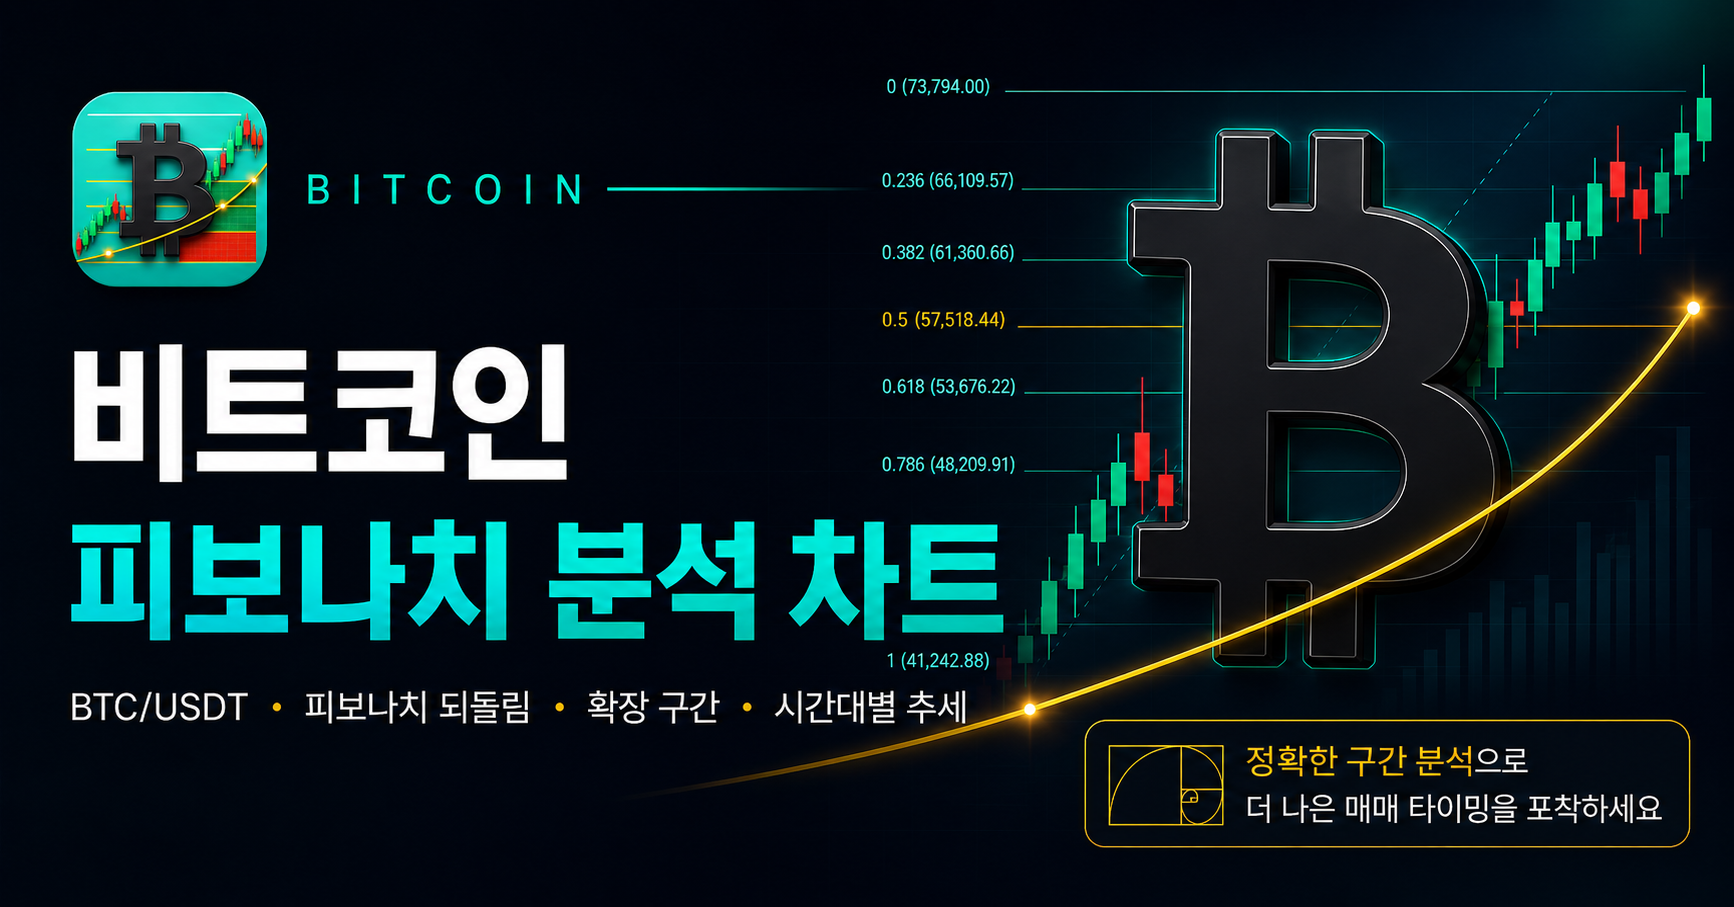
What is Fibonacci retracement?
Fibonacci retracement applies commonly used ratios to a selected high-low range to inspect retracement areas on a chart. This app also shows 127.2% and 161.8% extension zones alongside the most recent swing's 0%–100% retracement. These zones are reference points, not price predictions or trading signals, and should be considered with other information.
What this app helps with
Review meaningful recent highs and lows, where price sits within that range, and the Fibonacci zones and multi-timeframe context around it.
Key features
- Minute, hourly, daily, and weekly timeframes
- ZigZag swings and Fibonacci ranges that account for ATR(14)
- 0%–100% retracement and 127.2% / 161.8% extension zones
- Baseline moving averages, trend context, and connection status
How to use it
- 01
Choose a timeframe.
- 02
Check the connection status and last-received time.
- 03
Review the shown swing and Fibonacci zones with price action.
- 04
Compare other timeframes, then make any further assessment separately.
Inputs and outputs
- Input
- Selected timeframe and public BTC/USDT candle data
- Output
- Price chart, swing range, Fibonacci zones, baseline trend context, and connection status
Data and privacy
To show the chart, the browser connects directly to Binance Spot public Kline REST API and WebSocket. It does not provide orders, account connections, automated trading, or personal API-key entry.